Why I made it
I had been turning it over for years.
When you study Human Design you need to look at today’s sky. Not as astrological curiosity, but as part of the work: understanding what is being activated, what is closing, what is applying pressure.
Tools exist that do this. Good ones, too. Almost all of them paid, with an account, with a subscription, with limits. For a professional analyst that is an affordable expense. For a student who is just starting out, it is a barrier. And a barrier in exactly the place where there should not be one: between someone who wants to learn and the information they need in order to learn.
So I made it. It is published, it is free, it asks for no registration, it stores nothing and it has no owner beyond whoever uses it.
A tool that demands an account before showing you the sky is not a tool. It is a toll.
What you can see
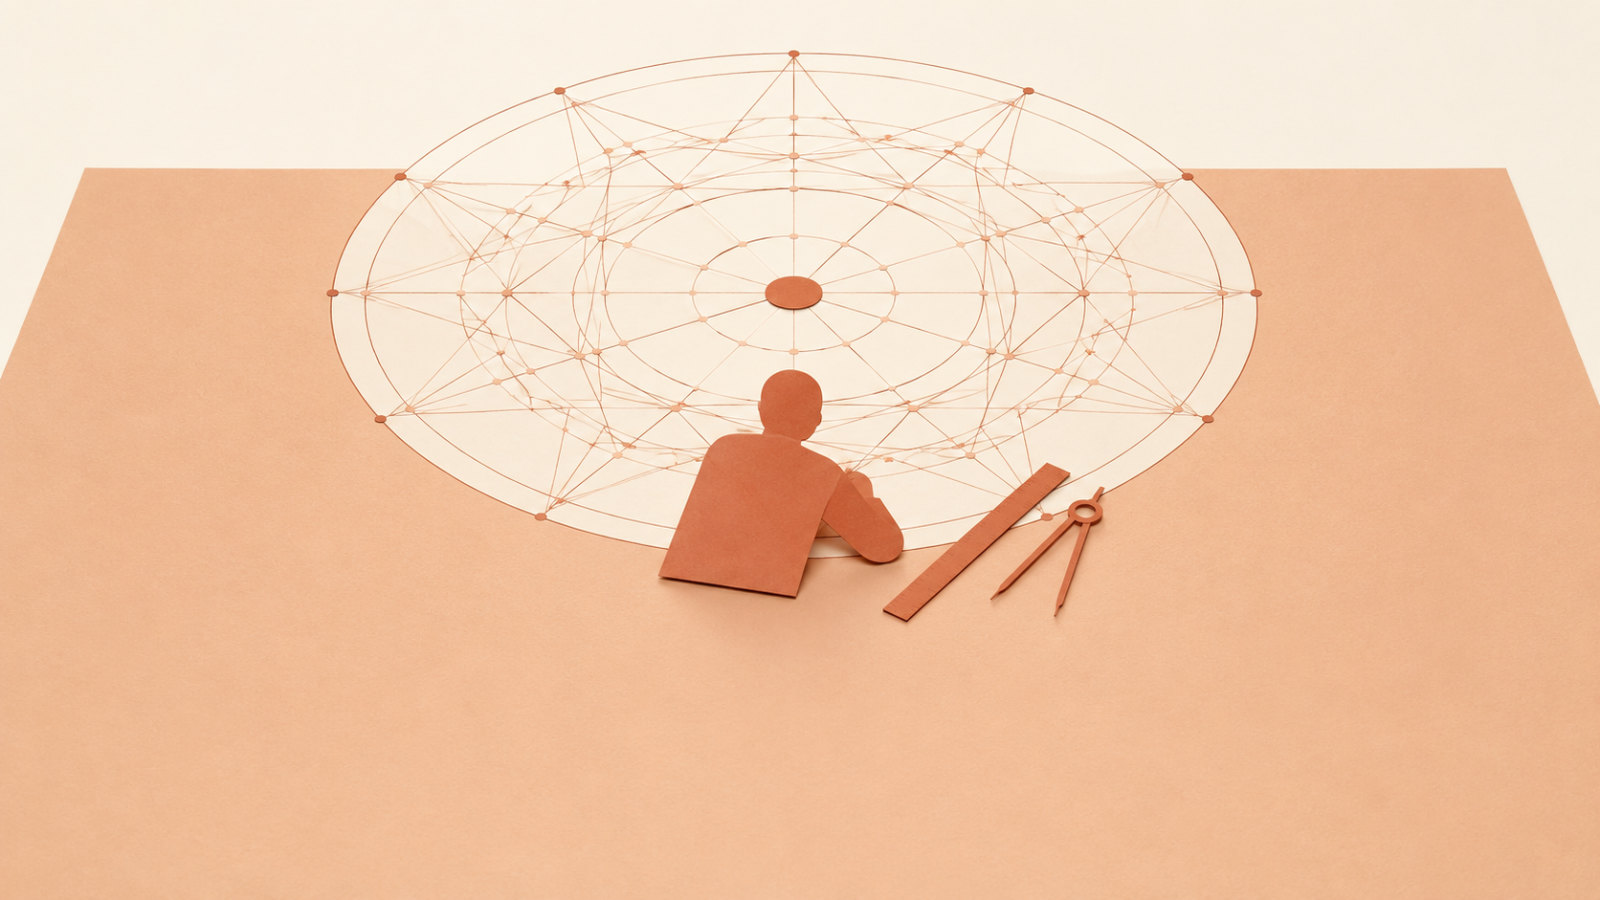
The wheel shows the planetary positions for the exact moment you open it. It updates on its own.
For each planet you can read:
- the zodiac sign
- the gate
- the line
- the colour
Everyone uses gate and line. The colour, far less — and that is where the fine detail begins. It is the third figure of the activation, the one that shows up when you stop reading the chart on the surface and start reading it properly. Having it in front of you without having to calculate it changes the rhythm of study.
The true Lunar Node and Chiron, calculated separately, are there too.
The channels that form
This is the part I was most interested in.
The sky, by itself, makes definition. At any given moment there are activated gates that connect to each other and form channels — a circuit open over all of us, changing every day.
Most tools give you the list of positions and leave you the work of crossing them mentally. Here the channels are drawn. You watch them appear and disappear. You see when the sky is linked up and when it is scattered.
Watching a channel form in the sky is not the same as deducing it from a list.
And when you cross that with your own chart, reading the transit stops being a calculation and becomes an observation.
The houses
Planetary positions are geocentric: they hold for any point on Earth. The houses do not. The houses depend on where you are.
That is why the tool asks for latitude and longitude — or takes them from your device if you let it — and calculates the Ascendant, the Midheaven and the cusps using the Placidus system.
It is the local part of the reading. The part that says not only what is happening in the sky, but where it is happening to you.
What it does not do
It does not calculate birth charts. It does not interpret. It does not tell you what to do with what you see.
It does not send your data anywhere: the whole calculation happens inside your browser, on your own device. The location stays saved on your machine, not on a server of mine.
It is not an oracle. It is a precision instrument that shows a state of the sky. The rest is your work.
The sky does not interpret. It only moves.
Who it is for
For analysts who want to check the transit quickly, without opening three tabs.
For students who need to see the mechanism working in real time — which is the only way a mechanism is really learned.
And for anyone curious enough to wonder what is above their head right now.
It is there. Use it. Share it.
Open the transit wheel →
If something you have read here resonates with you, we can talk.
Write to me